

How to Read Crypto Charts: The Ultimate Beginner’s Guide
Want to trade crypto but unsure where to start? Learning how to read crypto charts is your first step. These charts show price movements and trends, helping you make smarter trading decisions. In this guide, we’ll cover the types of crypto charts, key elements you need to know, and how to use technical indicators effectively.
Table of Contents
Key Takeaways
- Crypto charts provide essential insights into price movements, market trends, and trading volume, crucial for informed trading decisions.
- Candlestick charts are widely used among traders for their detailed representation of price movements, and recognizing patterns such as Doji and head and shoulders can signal potential market trends.
- Incorporating technical indicators like MACD, RSI, and Bollinger Bands enhances trading strategies by offering insights into market momentum and potential price reversals.
Understanding Crypto Charts
Crypto charts serve as visual tools that illustrate price movements over time, highlighting changing market trends. They offer valuable insights such as price changes, trading volume, and historical performance, which are essential for making informed trading decisions. Learning to read crypto charts helps traders grasp market dynamics, spot trading opportunities, and steer clear of costly errors.
These charts come in various forms, each providing different levels of detail and information. Understanding the types of crypto charts available and the significance of timeframes and intervals will set the foundation for effective chart analysis and crypto trading.
Types of Crypto Charts
Crypto charts come in several forms, each serving a unique purpose. Line charts, for instance, represent price movement over time by connecting a series of closing prices. They are particularly useful for assessing overall market direction and making high-level trading decisions. However, for a more detailed view, bar charts provide open, high, low, and close (OHLC) data for each time period. The small horizontal lines on a bar chart indicate opening and closing prices, offering a visual summary of price movements.
Candlestick charts are highly favored by crypto traders. They are considered one of the most popular chart types in the market. These charts illustrate price movements with color-coded candles, indicating market sentiment and potential buy/sell signals. Each type of chart has its own strengths and is suited to different trading strategies and objectives. Knowing these differences helps with effective chart analysis and successful cryptocurrency trading.
Timeframes and Intervals
The chosen timeframe and interval for crypto charts significantly affect the detail level in price data.
Common timeframes consist of:
- one minute
- five minutes
- one hour
- one day
- one week
Short-term traders often utilize minute to hourly timeframes for rapid analysis, allowing them to capitalize on quick market movements. Conversely, longer timeframes like daily or weekly are more suitable for swing traders and long-term investors, providing a broader perspective on market trends.
Choosing the right timeframe depends on your trading style and goals. A short-term trader might focus on minute-by-minute fluctuations, while a long-term investor would benefit from analyzing daily or weekly trends as part of their trading strategy.
Recognizing how different intervals impact your analysis is key to making informed trading decisions and creating effective strategies.
Anatomy of a Candlestick Chart
Candlestick charts, developed by Munehisa Homma, a Japanese rice trader in the 18th century, display price movements within a specific time frame using candlestick shapes. These charts convey detailed price information, including high and low prices, as well as opening and closing prices, over a set timeframe. The visual representation of price movements through candlesticks helps traders quickly grasp market sentiment and potential future movements.
Grasping the anatomy of a candlestick chart is crucial for accurately interpreting market data. Each candlestick provides a wealth of information about the trading period it represents. In the following subsections, we will dive deeper into the components of a candlestick and the common patterns that can signal significant market trends and potential trading opportunities.
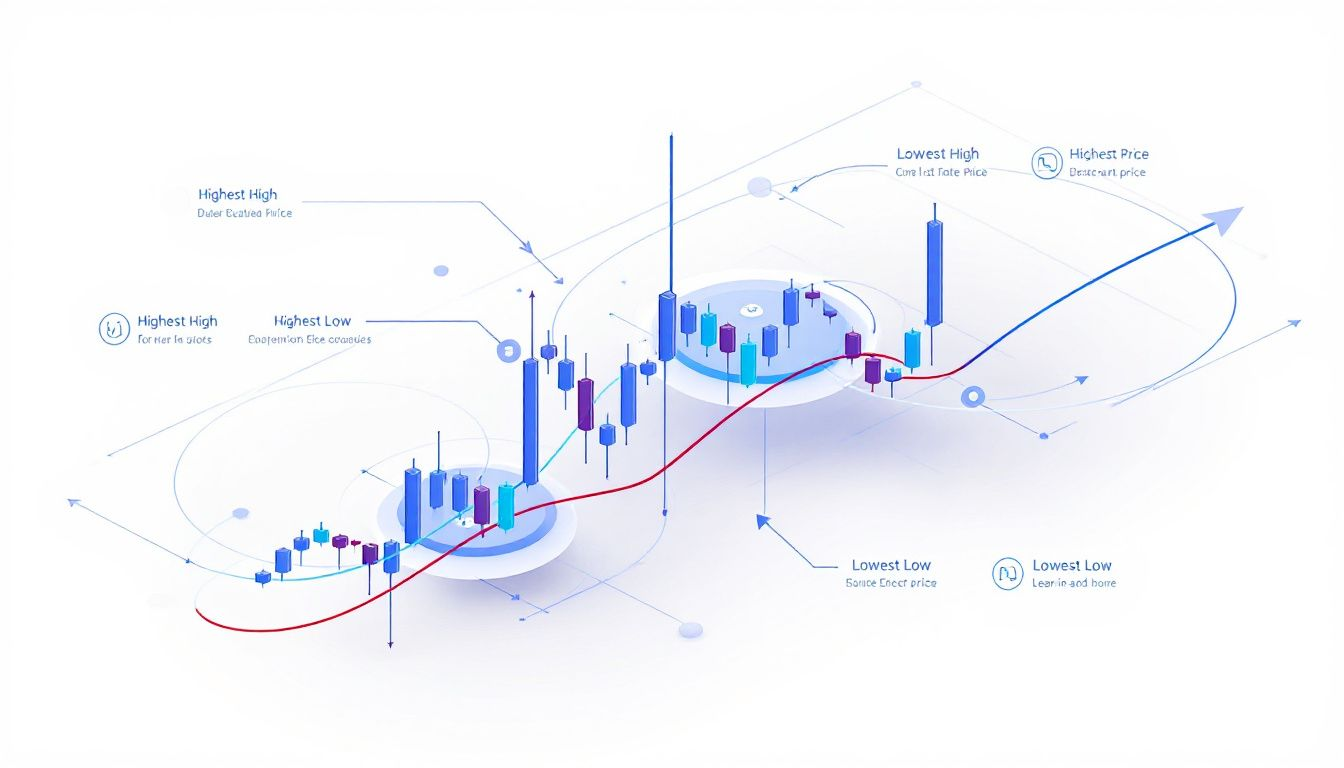
Components of a Candlestick
Each candlestick on a chart represents a specific time period and includes four key data points: the opening price, the closing price, the highest price, and the lowest price during that period. The body of the candlestick reflects the difference between the opening and closing prices, while the wicks (or shadows) illustrate the highest and lowest prices reached during the period. The upper wick indicates the highest price, while the lower wick shows the lowest price within the period. Additionally, the opening and closing price provide crucial insights into market trends.
The color of the candlestick adds another layer of information. Green candles indicate that the price went up during the period, reflecting bullish sentiment, while red candles indicate that the price dropped, reflecting bearish sentiment. Analyzing these components allows traders to gauge market trends and make informed decisions based on price movements.
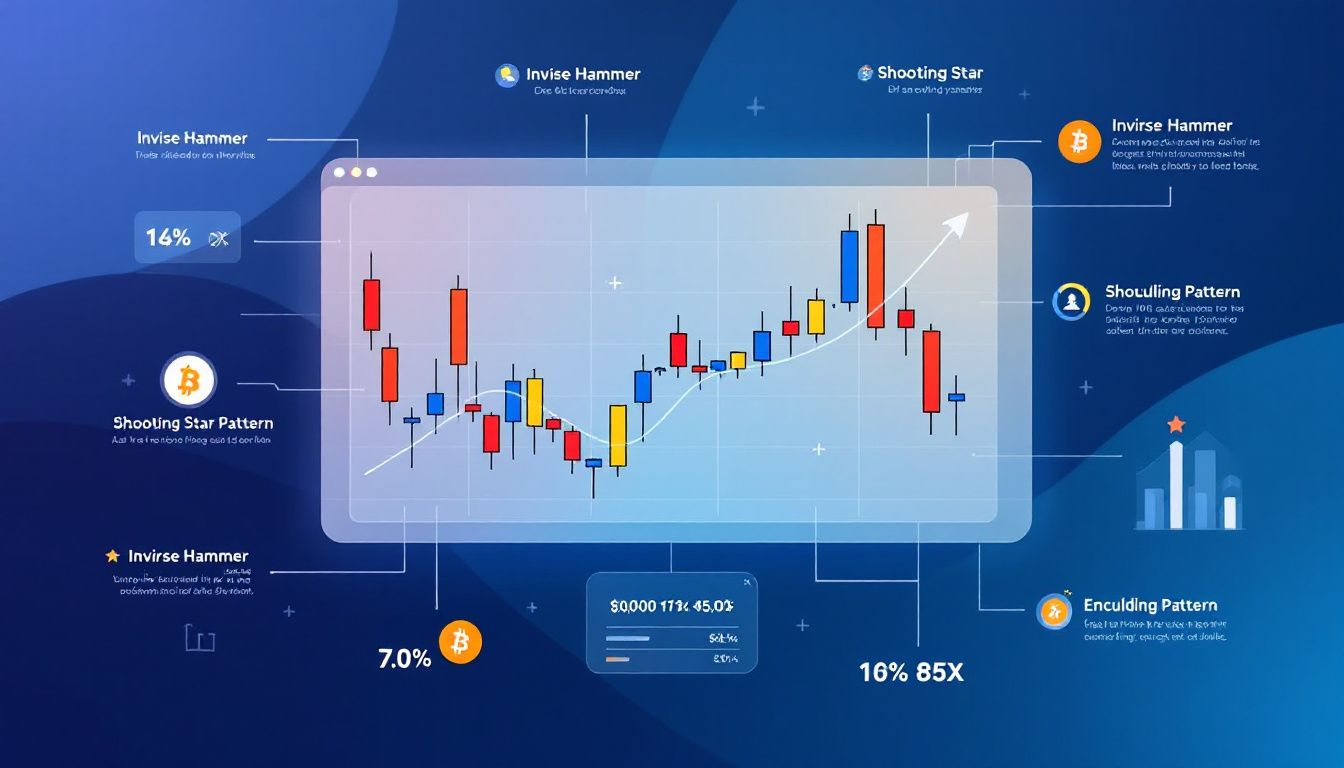
Common Candlestick Patterns
Candlestick patterns are crucial for identifying potential trend reversals or continuations in the crypto market. For example, Doji candlesticks signal market uncertainty, where the opening and closing prices are nearly the same. This pattern suggests indecision among traders and can precede significant price movements.
Another common pattern is the hammer, characterized by a long lower wick and a short body, usually suggesting a potential upward trend. Engulfing patterns, whether bullish or bearish, indicate strong reversal signals in market trends.
Recognizing these patterns helps traders anticipate potential trend reversals and adjust their strategies, enhancing success in the volatile cryptocurrency market.
Key Concepts in Technical Analysis

Technical analysis focuses on historical price patterns and volume data to predict future price movements. By studying past market behavior, traders can identify patterns and trends that may repeat, helping them make informed trading decisions. The main trends in crypto markets can be identified as uptrends, downtrends, or sideways trends. Identifying these trends is crucial for developing effective trading strategies.
Indicators are tools used for analyzing price movements, providing additional information based on price and volume data. The primary purpose of technical indicators in trading is to analyze trends effectively. Confirmation signals from technical indicators should always come from price movements to ensure accuracy.
In the following subsections, we will explore key concepts in technical analysis, such as support and resistance levels, moving averages, and the Relative Strength Index (RSI).
Support and Resistance Levels
Support and resistance levels are price boundaries that play a crucial role in technical analysis. Support levels form due to strong buying interest, causing prices to stabilize or reverse after falling. If prices breach a support level, they typically move lower until a new support level is established. Conversely, resistance levels are established when selling interest exceeds buying at a certain price, halting upward price movements.
Recognizing support and resistance levels helps traders set targets and manage risk effectively. Old resistance levels, once broken, often turn into new support levels. Identifying these levels allows traders to predict potential trend reversals and make more informed decisions.
Moving Averages
Moving averages smooth price data over time, helping to identify trends and potential price reversal points. Some traders utilize moving averages instead of drawing trend lines to identify trends. The slope of moving averages can indicate the strength of an uptrend, and they can also help identify support and resistance levels.
Traders utilize moving averages to identify the direction of trends. They also look for potential points where prices may reverse. Analyzing the slope and interaction of moving averages provides insights into market trends, aiding informed trading decisions.
Moving averages are a fundamental tool in technical analysis, providing a clear picture of market trends and potential future price movements, as well as indicating the overall market trend.
Relative Strength Index (RSI)
The Relative Strength Index (RSI) measures the speed and change of price movements in cryptocurrency trading. Typically calculated over 14 periods, the RSI assesses price momentum and market sentiment. An RSI value above 70 indicates that the market might be overbought, suggesting a potential price reversal. Conversely, an RSI value below 30 suggests that the market might be oversold, indicating a possible upward price movement.
Using the RSI, traders can identify overbought or oversold conditions, helping them make informed trading decisions. Incorporating the RSI into analysis helps traders understand market sentiment and anticipate potential trend reversals, enhancing their strategies.
Chart Patterns for Crypto Trading
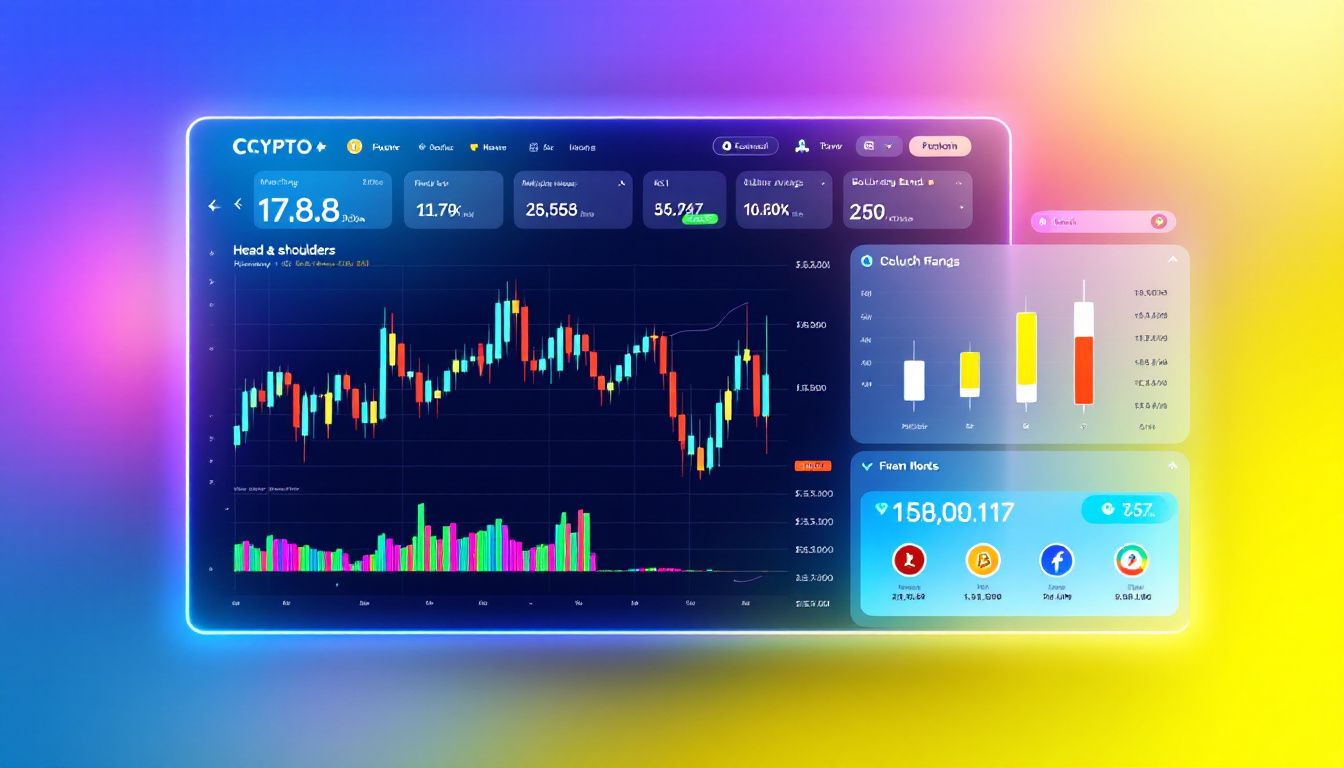
Chart patterns are crucial for traders as they help predict potential price movements in the crypto market. These patterns provide visual representations of market trends and can signal potential trend reversals or continuations. For example, a bullish flag pattern involves price consolidation after an uptrend, forming a rectangular shape with declining volumes. Recognizing these patterns can enhance trading strategies by confirming breakout signals with volume trends.
Identifying chart patterns like head and shoulders, double tops and bottoms, and triangles improves a trader’s ability to predict price movements and make informed decisions.
In the following subsections, we will explore these common chart patterns in detail, explaining their significance and how to use them effectively in crypto trading.
Head and Shoulders Pattern
The head and shoulders pattern is considered one of the most reliable indicators for trend reversal. This pattern indicates a bearish reversal after an uptrend and is formed by three peaks: a higher peak known as the head and two lower peaks referred to as the shoulders. Recognizing the head and shoulders pattern can help traders anticipate potential bearish movement in the market.
Identifying this pattern allows traders to adjust strategies to capitalize on anticipated trend reversals. The head and shoulders pattern is a powerful tool in technical analysis, providing clear signals of potential market movements and helping traders make informed decisions.
Double Tops and Bottoms
A double top pattern often indicates a potential shift from bullish to bearish momentum. This pattern is characterized by two peaks at roughly the same price level, suggesting that the buying pressure is exhausted, and a downward trend may follow. Conversely, a double bottom pattern indicates a bullish reversal, characterized by two troughs at approximately the same price level, suggesting that the selling pressure is waning, and an upward trend may follow.
Identifying double tops and bottoms can help traders anticipate potential trend reversals and adjust their trading strategies accordingly. These patterns are essential tools in technical analysis, providing clear signals of market sentiment and potential future price movements.
Triangles
Triangle patterns typically signal price continuation and are characterized by converging trend lines. Crypto charts feature three types of triangles. These are ascending, descending, and symmetrical triangles. An ascending triangle typically indicates a likely price breakout higher, while a descending triangle suggests a potential downward breakout. Symmetrical triangles indicate consolidation and can break out in either direction.
During a price breakout in triangles, increased trading volumes often confirms the breakout direction. Recognizing and analyzing triangle patterns helps traders anticipate market movements and make informed decisions based on chart data and trading volume.
Using Technical Indicators
Technical indicators are invaluable tools in technical analysis, used to forecast future price direction based on historical price data. Examples of these indicators include Bollinger Bands, MACD, RSI, and OBV. These indicators provide traders with additional layers of information, enhancing their understanding of market trends and price movements.
We’ll delve deeper into commonly used technical indicators. Effectively using these tools improves trading strategies, helping predict future price movements and make informed decisions.
Moving Average Convergence Divergence (MACD)
The MACD indicator is a powerful tool for identifying bullish and bearish trends. It comprises two lines: the MACD line and the signal line. The histogram represents the difference between these two lines. A crossing above the signal line in the MACD indicates a bullish signal, suggesting prices might rise.
One of the strengths of the MACD is its versatility. With no upper and lower limits, it can be used across various timeframes and market conditions. Incorporating the MACD into your strategies provides valuable insights into market trends and potential price movements, enhancing informed decision-making.
Bollinger Bands
Bollinger Bands are a technical analysis tool that measures market volatility by creating bands around a moving average. The bands expand during periods of high volatility and contract during periods of low volatility, making them useful for analysis. When the price breaks above or below the Bollinger Bands, it can signal a potential breakout or reversal, which traders watch for.
These bands can be applied across various market conditions to help traders make informed decisions based on volatility. Understanding and using Bollinger Bands helps traders anticipate price reversals or continuations, improving strategies and success rates.
On-Balance Volume (OBV)
The On-Balance Volume (OBV) indicator measures buying and selling pressure using volume. Developed by Joe Granville, the OBV indicator provides insights into whether more money is flowing into or out of a cryptocurrency. When the volume on down days outpaces up days, the OBV falls, indicating diminished buying pressure.
Understanding OBV helps traders gauge the strength of price movements and potential trend reversals. Incorporating OBV into analysis allows traders to make informed decisions based on price and volume data, enhancing overall strategies.
Practical Tips for Reading Crypto Charts
Successfully reading crypto charts requires more than just technical knowledge; it also involves practical skills and strategies. Understanding price dynamics helps traders make informed decisions based on market trends. Low trading volume during price movements signals a lack of conviction and potential trend reversal, while high trading volume during price decreases indicates strong exit pressure.
We will provide practical tips on choosing the right charting platform, using indicators without clutter, and applying risk management strategies to protect your capital.
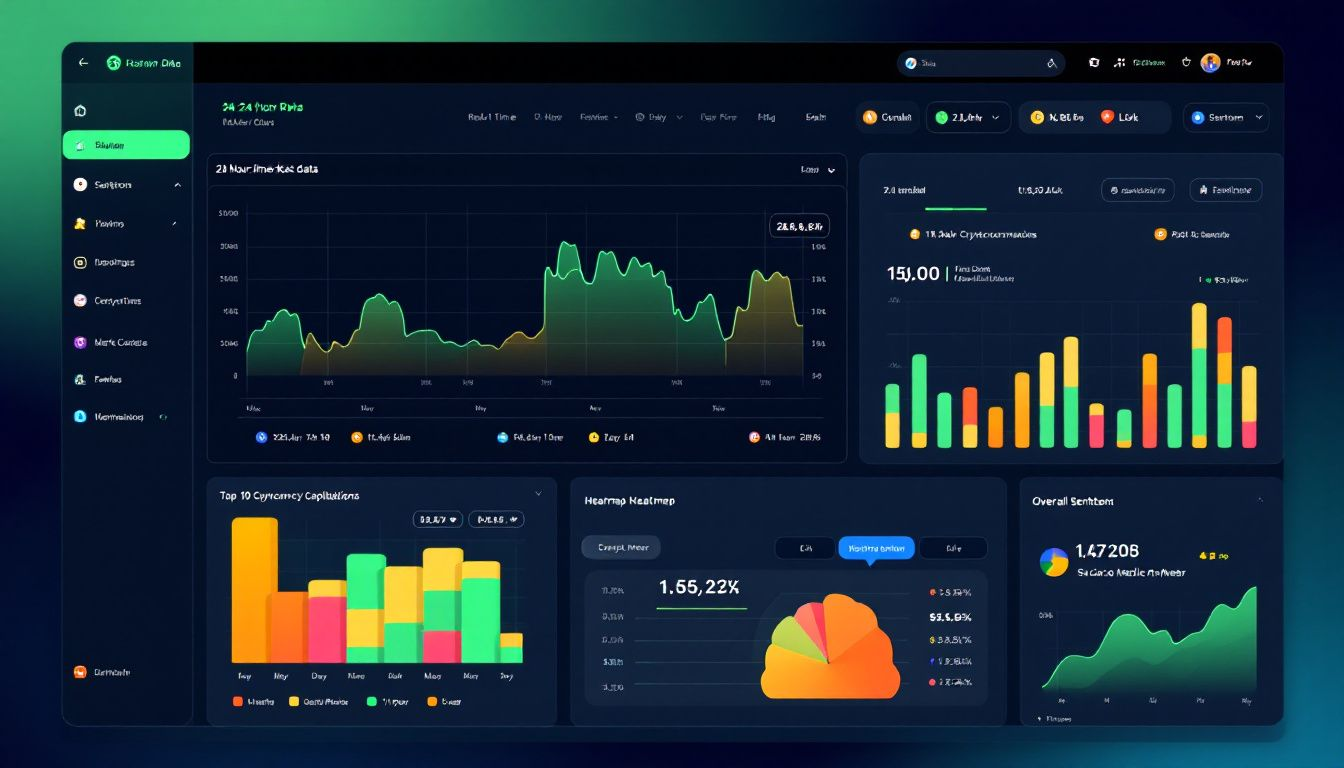
Choose the Right Charting Platform
Selecting the right charting platform is crucial for effective cryptocurrency analysis. Recommended platforms include TradingView, Binance, and Bybit. A good charting platform should offer a range of indicators and customization options to enhance analysis. Customization options might include adjusting candle colors, background, and gridlines.
TradingView, for example, offers different versions including free and premium, impacting user experience. Choosing a platform that meets your needs and preferences improves your chart analysis and overall strategy.
Combine Indicators, but Avoid Clutter
While combining multiple indicators can enhance clarity in trading signals, it’s crucial to avoid cluttering the chart. Cluttered charts filled with excessive indicators can lead to confusion and misinterpretations of price movements. Keeping a clean chart prevents confusion.
Using indicators that complement each other can provide a clearer picture of market trends and potential entry/exit points. Strategically selecting and combining indicators enhances chart analysis without overwhelming you with information.
Apply Risk Management Strategies
Implementing risk management strategies is crucial for protecting investment capital. Effective risk management involves setting stop-loss orders, diversifying your portfolio, and not risking more than you can afford to lose. These strategies help mitigate potential losses and ensure long-term success in trading.
Incorporating risk management practices into your strategy helps make informed decisions and protect investments, enhancing overall performance and success.
Summary
In conclusion, understanding how to read crypto charts is fundamental to successful cryptocurrency trading. By mastering the various types of charts, timeframes, and technical indicators, traders can make more informed decisions based on market trends and price movements. Key concepts in technical analysis, such as support and resistance levels, moving averages, and RSI, play a crucial role in predicting future price movements and developing effective trading strategies.
With the practical tips provided, including choosing the right charting platform, combining indicators effectively, and applying risk management strategies, you can enhance your chart analysis and improve your trading outcomes. Armed with this knowledge, you’re now better equipped to navigate the volatile world of crypto trading and make more informed, confident trading decisions.
Frequently Asked Questions
What is the best crypto chart reading?
The best crypto chart reading can be achieved using TradingView, as it provides advanced features, customizable indicators, and real-time data from various exchanges, catering to both beginners and professionals. This platform excels in delivering a comprehensive charting experience.
How to know if a crypto is going up?
You cannot predict with certainty if a cryptocurrency will increase in value, but analyzing supply and demand dynamics can provide insights into potential price movements. Understanding market trends and economic theory is essential for making informed decisions.
What are the most common types of crypto charts?
The most common types of crypto charts are line charts, bar charts, and candlestick charts, each providing different levels of detail for diverse trading strategies. Understanding these chart types is essential for effective analysis and decision-making in the crypto market.
How do I choose the right timeframe for my crypto charts?
Choosing the right timeframe for your crypto charts hinges on your trading style; short-term traders should focus on minute-to-hourly intervals, while long-term investors should consider daily or weekly timeframes for a more comprehensive view. Tailor your approach to align with your investment strategy for optimal results.
What is the significance of support and resistance levels in crypto trading?
Support and resistance levels are crucial in crypto trading as they indicate potential price reversals and help traders establish target levels for gains. Understanding these boundaries can enhance trading strategies and decision-making.


Comments: 0